This week we've reached the 35,000 tests milestone so we thought it might be interesting to do some research in the statistics we've gathered during the browsers tests. We at TestingBot run Selenium tests for our customers during which we gather technical statistics about the browsers running the tests. Time per test, number of crashes, CPU/Ram usage per browser and a lot more statistics are gathered in our datastore.
Let's take a look at what we've discovered with our statistics. These results were obtained from a sample of 30,000 Selenium tests in the last 8 weeks.
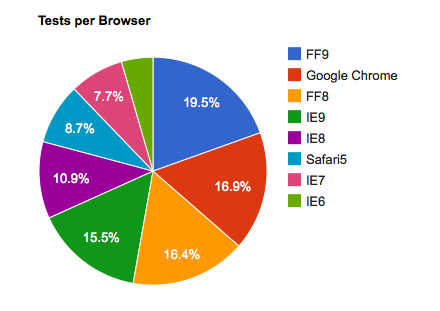
Let's start with the number of tests per browser:

As you might have expected, most of our tests are run on newer browsers, with Firefox 9 leading the group. Please note that even though tests have been run on Opera and Android, their share was just too small to include in this graph.
Next we decided to check how much time difference there is between browsers when executing the same (simple) test.

IE6 being the slowest browser (32 seconds to execute a test) is no surprise here. The reason why Safari5 is slow is because we're running all Safari 5 tests with *safariproxy, this is currently the only way to run Selenium tests on Safari 5.
Below is a graph indicating how much RAM (memory) each browser on average uses during a single test.
Clearly Google Chrome is the winner when it comes to using a low amount of RAM.

We'll keep gathering these statistics and from time to time update our blog with some statistics. In the meantime we're working hard on improving the stability of the browsers on our Selenium grid.
Browser crashes are logged and investigated plus we keep improving our grid to avoid timeout errors and other common problems when dealing with browsers.
If you're not yet a user of our Selenium grid, please consider joining to run your tests on our selenium cloud testing service.