Watch your tunnel from Grafana
Production tunnels are easier to operate when you can see their health at a glance. TestingBot Tunnel ships with a built-in Prometheus-compatible metrics endpoint, so you can scrape it from any monitoring stack you already run.
- Prometheus
- Grafana ready
- Port 8003
Enable the metrics endpoint
The metrics endpoint is enabled by default on http://localhost:8003. Override the port with --metrics-port.
java -jar testingbot-tunnel.jar --metrics-port 9100If the tunnel host is reachable from the network (for example a shared CI runner), protect the endpoint with HTTP Basic Auth:
java -jar testingbot-tunnel.jar --metrics-auth ops:s3cretExport TESTINGBOT_METRICS_AUTH instead of passing credentials on the command line. See the security guide.
Available metrics
Tunnel-specific series are prefixed with testingbot_. The endpoint also exposes the standard JVM and process metrics from the Prometheus Java client. The full label set is always documented at the /metrics endpoint itself.
Tunnel state
| Metric | Type | Meaning |
|---|---|---|
| testingbot_tunnel_up | gauge |
1 when the tunnel is connected, 0 while reconnecting or down. The single most important alerting signal. |
| testingbot_tunnel_info | info | Static labels with the tunnel build (version, id, name). Use for dashboard headers and version filters. |
| testingbot_tunnel_uptime_seconds | counter | Seconds since this tunnel process started. Drops on restart, useful for detecting flapping. |
| testingbot_tunnel_reconnects_total | counter | Total tunnel reconnects since startup. Sustained increases indicate an unstable upstream link. |
| testingbot_active_connections | gauge | Number of in-flight client connections through the tunnel right now. |
| testingbot_tunnel_connect_duration_seconds | histogram | Time taken to establish the tunnel itself (cold-start latency). Buckets _bucket, _sum, _count. |
HTTP traffic
| Metric | Type | Meaning |
|---|---|---|
| testingbot_http_requests_total | counter | HTTP requests proxied since startup. Labels: method, code. Use rate() for throughput, filter on code=~"5.." for errors. |
| testingbot_http_request_duration_seconds | histogram | End-to-end HTTP latency. Compute p50/p95/p99 with histogram_quantile(). |
| testingbot_https_connect_total | counter | HTTPS CONNECT sessions established. Labels: code. |
| testingbot_https_connect_duration_seconds | histogram | CONNECT handshake latency, suitable for histogram_quantile(). |
| testingbot_https_connect_errors_total | counter | CONNECT errors. Label: reason (TLS, target unreachable, timeout, ...). |
| testingbot_proxy_bytes_transferred_total | counter | Total bytes proxied (both directions). Use rate() for throughput in B/s. |
| testingbot_errors_total | counter | Generic proxy errors. Label: name (the error class). Useful for alerting on burst increases. |
JVM and process metrics
The endpoint also exposes the standard jvm_* and process_* series from the Prometheus Java client. These help you size the tunnel host, detect memory pressure and catch garbage-collection pauses.
| Metric | Type | Meaning |
|---|---|---|
| jvm_memory_bytes_used | gauge | Bytes of heap and non-heap memory in use. Label: area (heap or nonheap). |
| jvm_memory_bytes_max | gauge | Maximum bytes available per memory area. Pair with _used to compute headroom. |
| jvm_memory_pool_bytes_used | gauge | Per-pool memory usage (Eden, Survivor, Old Gen, Metaspace, ...). Label: pool. |
| jvm_gc_collection_seconds_count | counter | Number of GC collections. Label: gc (collector name). |
| jvm_gc_collection_seconds_sum | counter | Total time spent in GC. Use rate() to see GC pressure over time. |
| jvm_threads_current | gauge | Live thread count. Watch for runaway growth. |
| jvm_threads_daemon | gauge | Daemon thread count. |
| jvm_threads_peak | gauge | Peak thread count since process start. |
| jvm_classes_loaded | gauge | Currently loaded classes. |
| jvm_buffer_pool_used_bytes | gauge | Direct and mapped NIO buffer usage. Label: pool. |
| process_cpu_seconds_total | counter | Total CPU time consumed by the process. Use rate() for CPU utilisation. |
| process_resident_memory_bytes | gauge | RSS memory of the tunnel process as reported by the OS. |
| process_open_fds | gauge | Open file descriptors. Compare with process_max_fds to spot leaks. |
| process_start_time_seconds | gauge | Unix epoch when the process started. Useful for restart detection. |
All names above are the canonical Prometheus Java client names. Open http://localhost:8003/metrics to see the full live list and their # HELP / # TYPE annotations.
Prometheus scrape config
Add a job to your prometheus.yml that targets the tunnel host.
scrape_configs:
  - job_name: testingbot_tunnel
    static_configs:
      - targets: ["tunnel-host.example.com:8003"]
    basic_auth:
      username: ops
      password_file: /etc/prometheus/testingbot_metrics_password
Grafana dashboard
A ready-made Grafana dashboard ships with the tunnel source. Import it once and you have a full Overview / HTTP / Tunnel-health view in seconds.
Download testingbot-tunnel.json from the
grafana-dashboard examples folder
on GitHub. In Grafana go to Dashboards → New → Import, paste the JSON or upload the file, pick your Prometheus data source, and click Import.
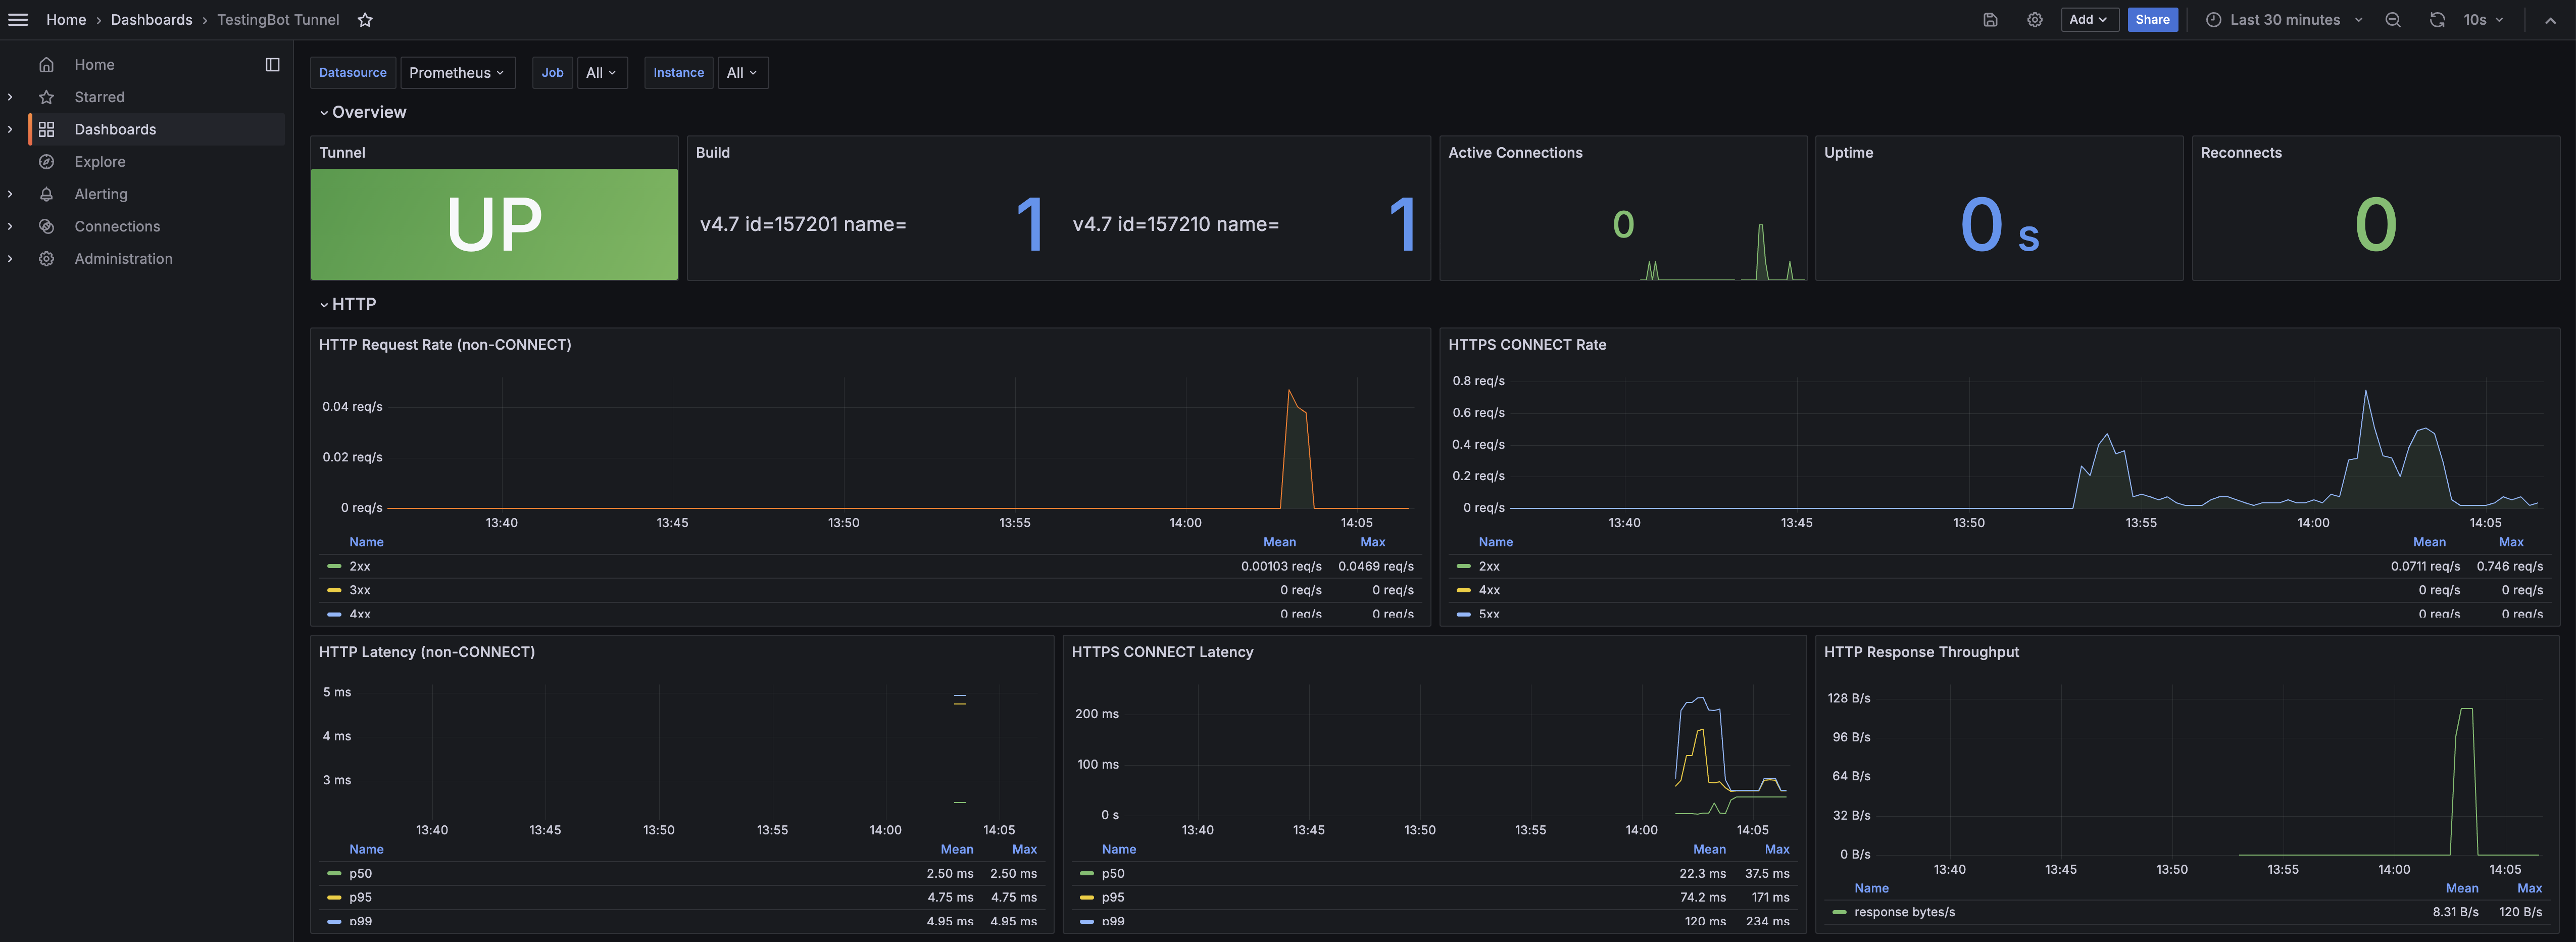
The bundled dashboard groups panels into two rows:
- Overview: Tunnel status (UP/DOWN), build version, active connections, uptime and reconnect counter.
- HTTP: request rate by status class, HTTPS CONNECT rate, p50/p95/p99 latency and response throughput.
Want a turnkey setup? The repo also includes a docker-compose example that spins up Prometheus + Grafana already wired to scrape a local tunnel and load the dashboard automatically. Useful for local development or a single-machine CI runner.
git clone https://github.com/testingbot/Testingbot-Tunnel.git
cd Testingbot-Tunnel/examples/docker-compose-prometheus-grafana
docker compose up -d
# Grafana on http://localhost:3000  ·  Prometheus on http://localhost:9090
If you prefer to build the dashboard yourself, here are the most useful PromQL queries:
Alert ideas
-
Tunnel restart: fire when
testingbot_uptime_secondsdrops to under 60 seconds. - Error spike: fire when the 5-minute error rate exceeds your normal baseline.
-
Stalled connections: fire when
testingbot_connectionsstays at zero during normal CI hours. -
Endpoint unreachable: fire on Prometheus
up == 0for the tunnel target.