Test Analytics dashboard
The Test Analytics dashboard summarises every automated run in your account over a time range: the pass rate and how it changed, the tests that need attention and why they fail, the environments that fail the most, and your recent builds.
Open it with Analytics in the sidebar of the member dashboard.
The line under the title tells you what the page covers, for example Every automated run in your account · 42 tests · 9 environments · 31 builds.
The page reads from top to bottom, from the overall answer to the detail behind it:
- The digest: one line that says whether the range is healthy.
- The numbers: runs, pass rate, failed runs, flaky tests, tests and duration, each against the range before.
- Runs per day: a chart of every day in the range.
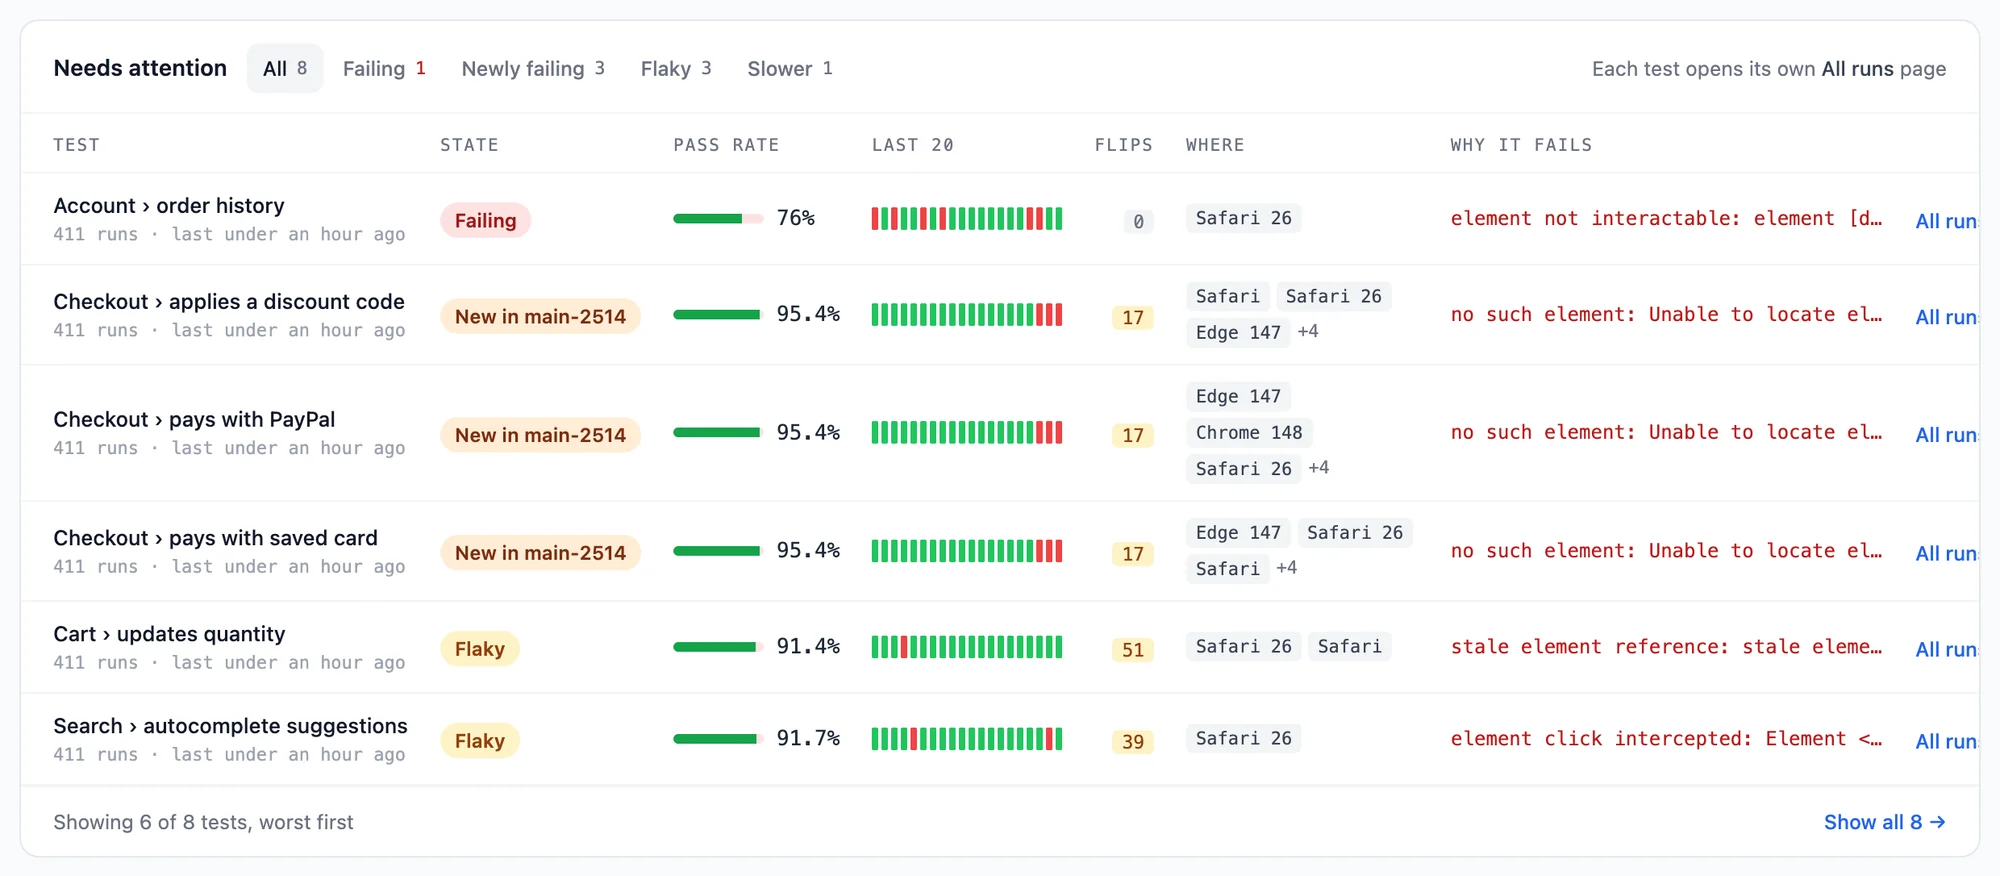
- Needs attention: the tests that are failing, newly failing, flaky or slower.
- By environment and Top errors: where and why runs fail.
- Recent builds: the newest builds in the range.
Range and filters
The filter bar at the top decides which runs every part of the page is about. A change applies at once: there is no separate search button.
| Control | Options |
|---|---|
| Range |
24h, 7d, 30d (the default), 90d or Custom.
The preset ranges end now.
Custom shows a From and To date: pick whole days and press Apply. A custom range can span up to 366 days.
|
| Environment |
Opens the same browser and device picker as the test dashboard. Select one or more browsers, devices and operating systems.
With one selected, the button shows its name (for example Chrome 141 · Windows 11); with more, how many are selected.
|
| Build | A searchable list of your builds, newest first. Tick one or more and press Apply; Clear removes the selection. The list shows the first 100 matches: type part of a build name to find older builds. |
| Tag | Only runs with this tag, set with the groups capability. |
| Started by | Only runs started by one member of your team. Shown when your account has team members. |
The range in dates is shown on the right of the filter bar, for example Sep 15 – Oct 14, 2026 · UTC. All days are UTC days.
When nothing ran in the selection, the page says No runs in this selection. Your earlier runs are still there: widen the range, clear a filter, or use Reset to the last 30 days.
You can also filter by clicking: a name in the By environment table filters the page to that environment.
The digest
The first card sums up the range in a sentence or two, with a label on the left:

| Label | When |
|---|---|
| Needs attention | The pass rate is under 95%, the pass rate fell by 2 points or more against the range before, or at least one test is failing. |
| Healthy | None of the above. |
| No runs | No automated run finished in the range. |
The sentence can say up to four things:
- The pass rate over the range and how it moved, for example Pass rate 98.4% over 17,262 runs, down 0.8 pts on the range before.
- How many tests are failing and flaky, and where most of the flaky ones flake, for example 4 tests are failing and 3 are flaky, 2 of them on Safari 26.
- An environment that fails far more than it runs: Safari 26 is 24% of the runs but 67% of the failures. This is said when an environment's share of the failed runs is 10 points or more above its share of all runs.
- The test to fix first, with a link to its All runs page: Fix first: Account › order history, which failed 97 of its 411 runs.
The numbers
Below the digest, six numbers describe the range. Most have a change next to them, measured against the range of the same length just before this one: the 30 days before the last 30 days, for example. A green change is an improvement, a red one is worse, and a grey one is neither good nor bad.
| Number | What it is | Change shown |
|---|---|---|
| Runs | Finished automated runs in the range. The sparkline shows the runs per day. | In percent |
| Pass rate | Passed runs out of the runs that passed or failed. Runs without a result (unknown) are left out. The sparkline shows the pass rate per day. | In percentage points (pts) |
| Failed runs | Runs that failed. The sparkline shows the failed runs per day. | In runs |
| Flaky tests | Tests whose result keeps changing, out of all tests. See how flaky is decided. A + after the number means it is a lower bound: more tests failed than could be read. |
None |
| Tests | Different test names that ran in the range. | In tests |
| Duration p50 / p95 | The median and 95th percentile duration of the passed runs: half of the passed runs took less than p50, 95% took less than p95. | p50, in seconds |
Runs per day
A bar for every day in the range, with the runs of that day stacked by their result:
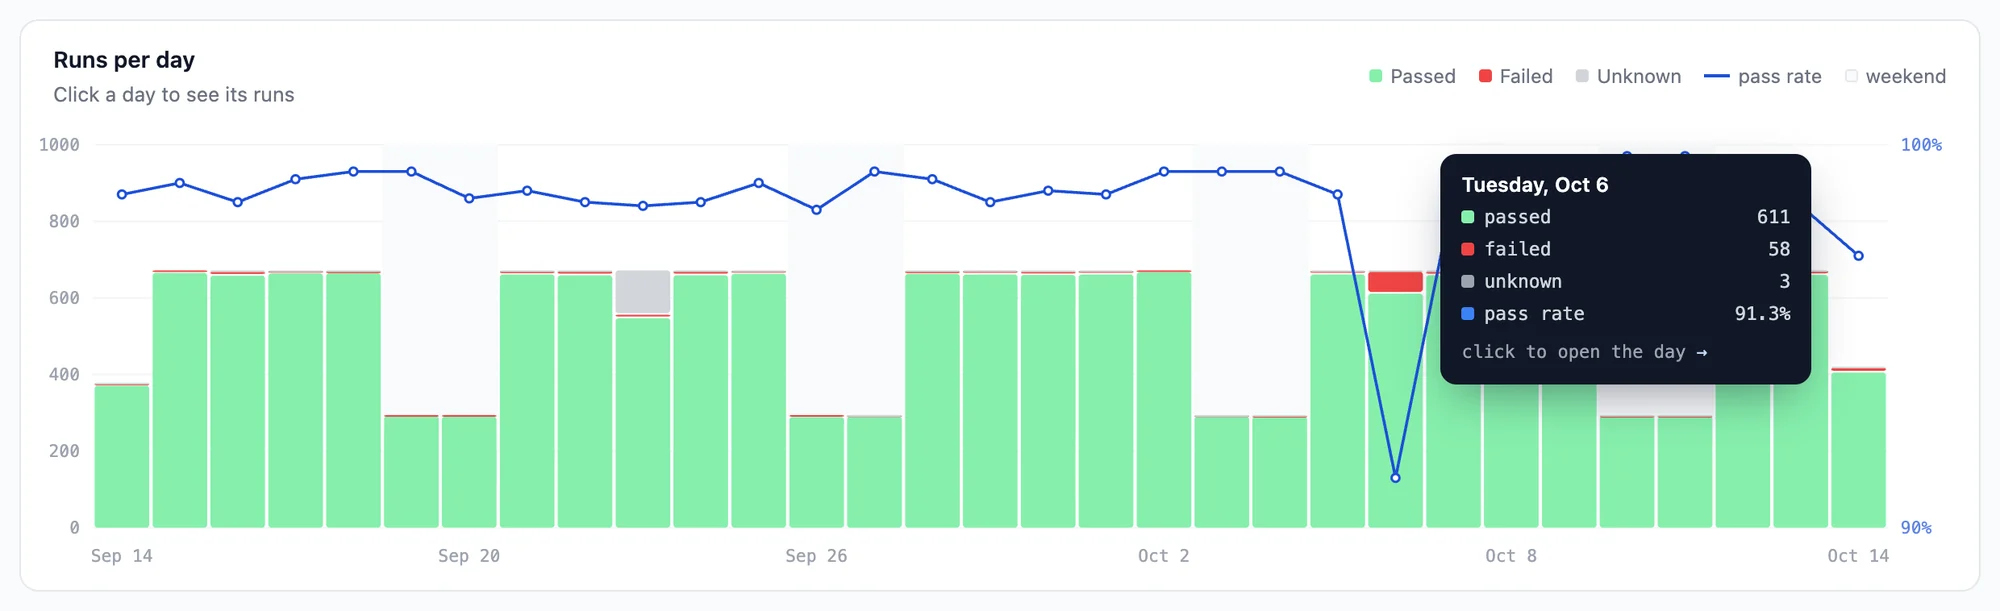
- Light green: passed runs.
- Red: failed runs.
- Grey: runs without a result (unknown).
- Blue line: the day's pass rate, read on the percentage scale on the right. That scale starts at the lowest pass rate in the range (rounded down to 10%, and at most 90%), so a drop from 99% to 94% is easy to see.
- Shaded columns: weekends, so a quiet Saturday is not mistaken for a problem.
Hover over a day to see its date, the passed, failed and unknown runs, and the pass rate. Click a day to open that day's page: what changed against the day before, hour by hour, and every run.
Needs attention
The tests worth a look, worst first. Every test is the set of runs with the same name, and it gets one state:
| State | Meaning |
|---|---|
| Failing | Its last 5 runs failed, an environment failed every one of its runs (3 or more), or its latest build failed every run after an earlier build passed. |
| Newly failing | Failing now, and it ran without failing in the range before. When a build broke it, the label names the build: New in 1.42.0. |
| Flaky | On at least one environment, it failed between 10% and 90% of 5 or more runs, and its result flipped at least twice. |
| Slower | The average duration of its passed runs grew by 30% or more against the range before, with at least 5 passed runs in each range. |
These are the same rules as the verdict on a test's All runs page, so a test called flaky here is flaky there too. All thresholds are on Metrics and definitions.
Tabs
All lists every test in the table. The Failing, Newly failing, Flaky and Slower tabs narrow it to one state and show how many tests each has; a tab with no tests is not shown. The first 6 tests show; Show all lists the rest.
Columns
| Column | Shows |
|---|---|
| Test | The test name, how many runs it had, and when it last ran. |
| State | Failing, Newly failing (or New in <build>), Flaky or Slower. |
| Pass rate | The test's own pass rate in the range. |
| Last 20 | A bar per run for its last 20 runs, oldest on the left: green passed, red failed, grey unknown. |
| Flips | How often the result changed between consecutive runs on the same environment. More than 6 is highlighted. |
| Where | The browsers or devices it fails on (up to 3, then +N). For a slower test: where it ran. |
| Why it fails |
The error of its latest failed run, and the step it failed at, for example step 7 · click.
This is filled in a moment after the page shows, because it is read from the run's steps.
For a slower test: its average duration before and now, for example avg 41s → 58s.
|
Click a test name, or All runs →, to open the All runs page of that test.
To keep the page fast, Needs attention reads the runs of the 20 tests that failed most recently (and of tests that got slower), up to 1,000 runs each.
When more tests than that failed, the flaky count shows a + and the digest says at least.
Narrow the range or filter by build or environment to see the others.
By environment
A row per browser or device, most runs first. This shows whether failures are spread evenly or come from one place.
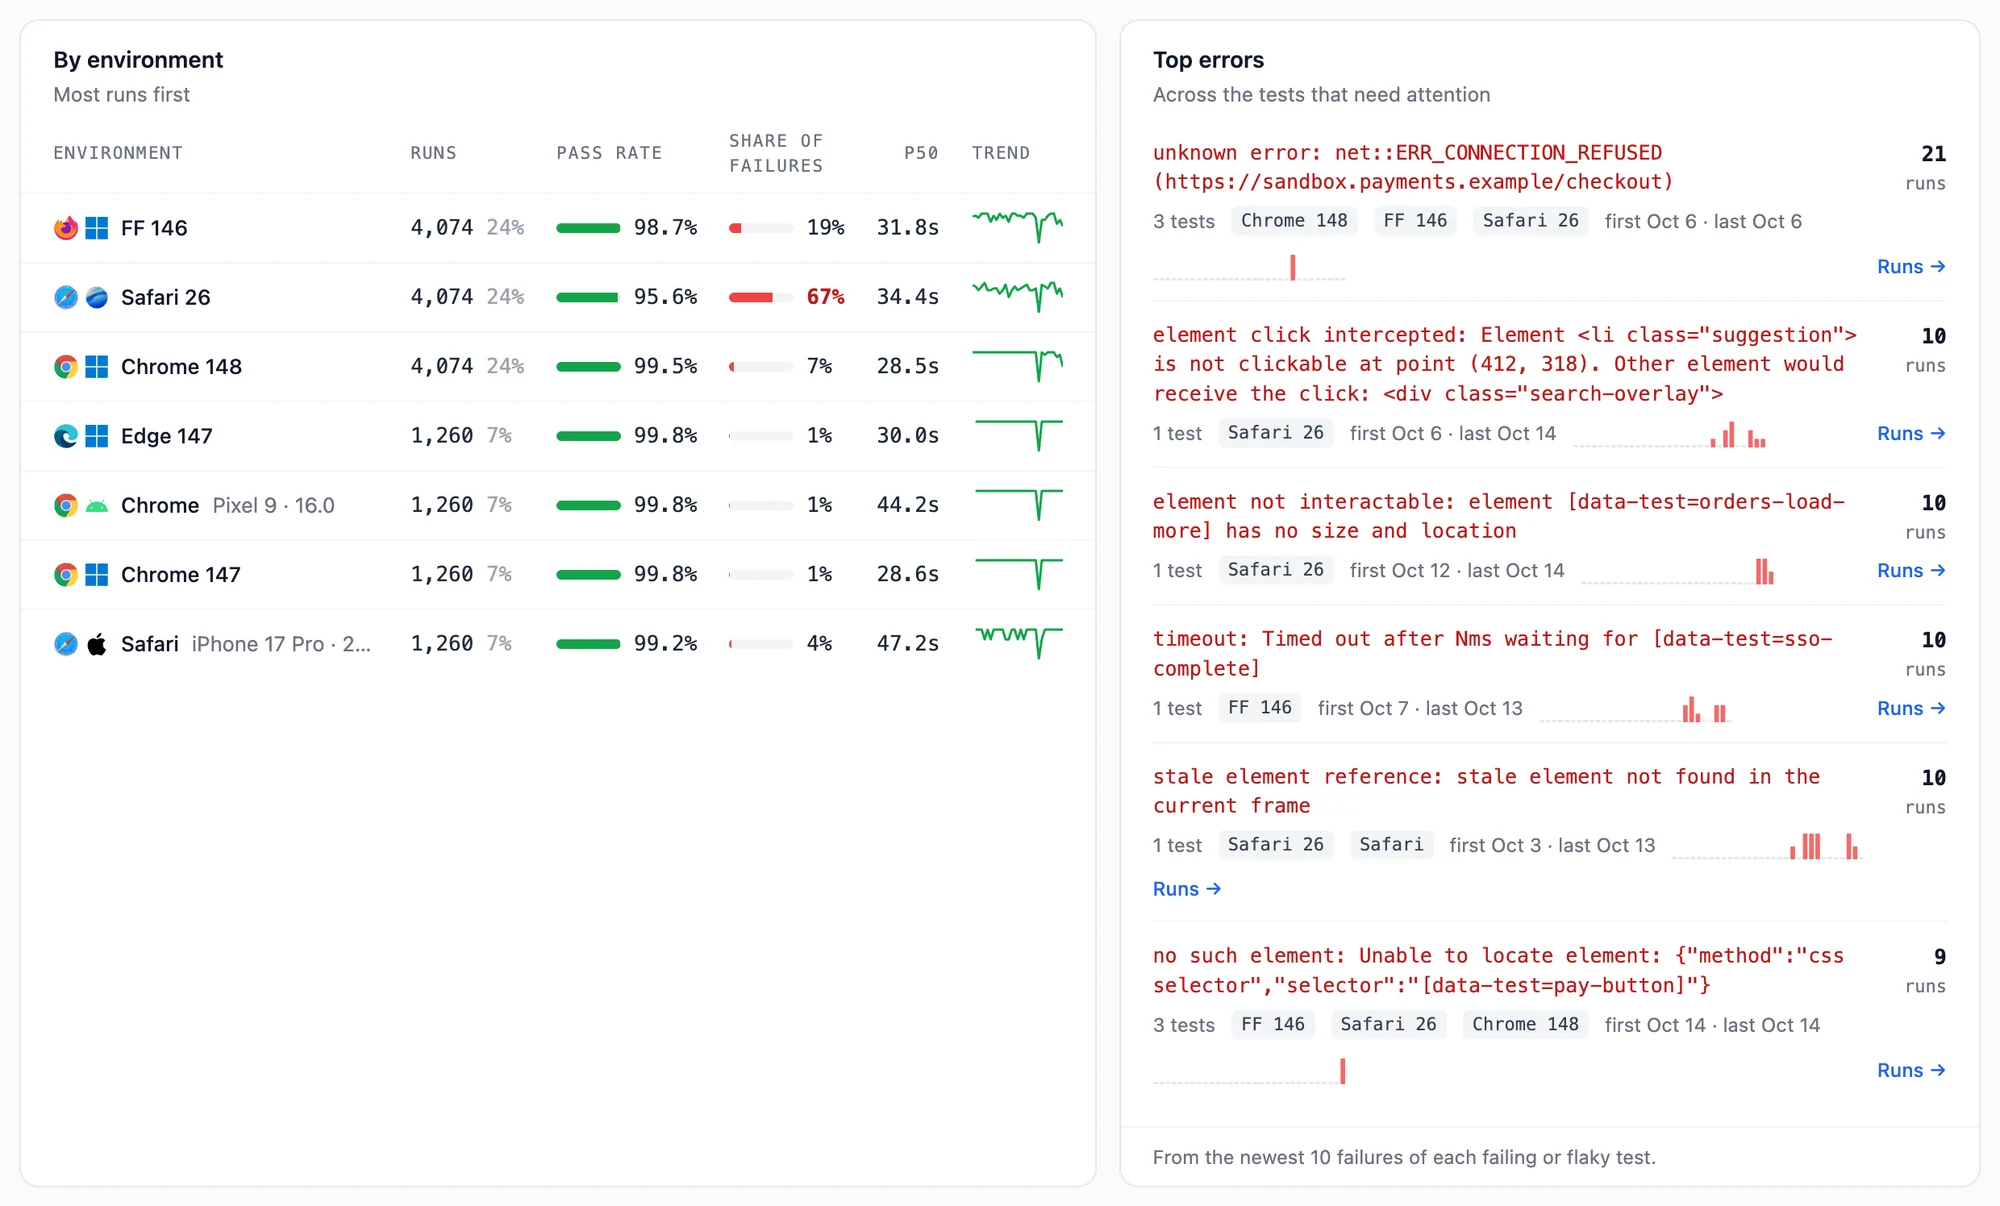
| Column | Shows |
|---|---|
| Environment | The browser and version with its operating system logo, or for a mobile run the device, for example Safari · iPhone 16 (real device). Hover for the full name. |
| Runs | Its runs, and its share of all runs in percent. |
| Pass rate | Its pass rate in the range. |
| Share of failures | Its part of all failed runs. Shown in bold red when it is 10 points or more above its share of runs: this environment fails more than its fair share. |
| p50 | The median duration of its passed runs. |
| Trend | Its pass rate per day. |
Click an environment to filter the whole page to it.
A native app test (Espresso, XCUITest, Maestro or Appium with an app) and a browser test on the same device are listed as two environments, because they test different things.
Top errors
The errors that fail the most runs, across all tests that are failing or flaky. Where Needs attention lists tests, Top errors groups their failures by cause: one broken selector or one unreachable server often fails many tests at once.
A run's error is the one its test detail page shows: the last step in error and its message. Errors are grouped by message, with the parts that change between runs taken out, so these count as one error:
- the
(Session info: chrome=141.0…)that Chrome adds, - element and session ids (hexadecimal ids of 16 characters or more),
- durations such as
30000msor1.5s.
Each error, most runs first, shows:
- the error message, and how many runs failed with it,
- how many tests it failed, and on which browsers or devices (up to 4, then
+N more), - the first and last day it happened in the range,
- a bar per day with its failures, so you see whether it started on one day or comes and goes,
- Runs →: the failed runs of the test with the most of these failures, on its All runs page.
Top errors loads a moment after the rest of the page, because each error is read from the run's steps. It reads the newest 10 failures of up to 30 tests (those with the most failures), and says so under the list when that is a sample.
A failure without a step in error is not grouped. This happens when the test marked itself as failed (a visual or accessibility check, for example) or failed further back than the steps that are read.
Recent builds
The 5 newest builds that ran in the range, newest first:
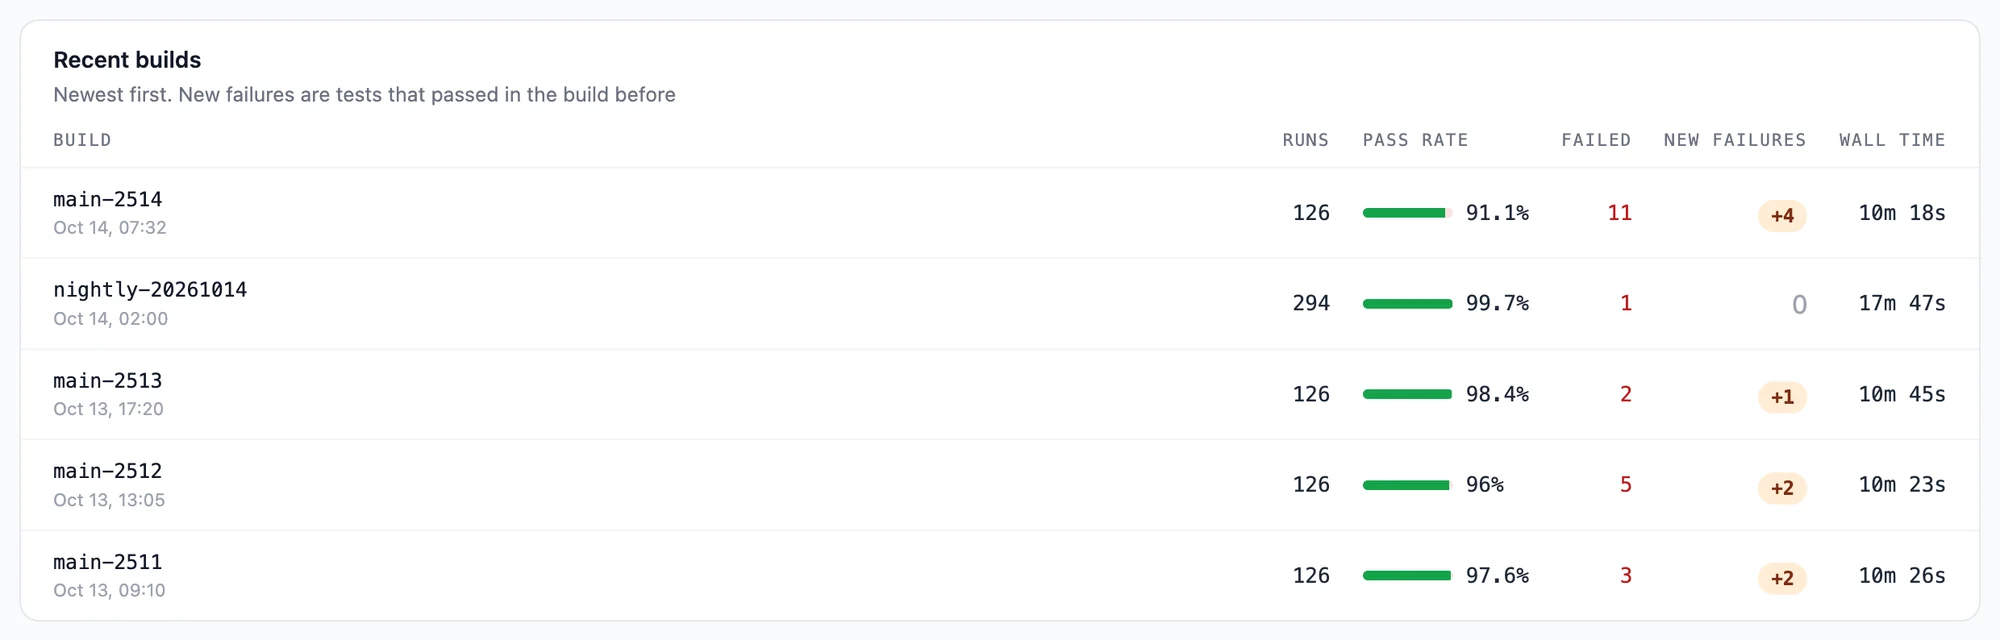
| Column | Shows |
|---|---|
| Build | The build name and when its first run started. |
| Runs | Its runs in the range. |
| Pass rate | Its pass rate. |
| Failed | Its failed runs. |
| New failures | Tests that failed in this build and passed in the build before it, for example +3. A dash means there is no earlier build in the range to compare with. A flaky test that happened to fail is counted here too; the build page tells flaky tests apart. |
| Wall time | From the start of its first run to the end of its last. |
Click a build to open its build page. When no run in the range has a build, the card explains how to set the build capability.
Copy link and CSV export
The range, the filters and the tabs are all part of the page's URL. Copy link copies it, so a team member opens exactly the same view. You can bookmark it too.
Export CSV downloads the runs per day of the current range and filters, as test-analytics-<from>-<to>.csv:
| Column | Contains |
|---|---|
date |
The UTC day, as YYYY-MM-DD
|
runs |
Finished runs that day |
passed |
Passed runs |
failed |
Failed runs |
unknown |
Runs without a result |
pass_rate |
Passed out of passed and failed, in percent (empty when none passed or failed) |
For every single run of a day, use the export on the day's page. For the same numbers in your own tools, use the Insights API.
The numbers are kept for 5 minutes per range and filter, so a reload is fast. A run that finishes in the meantime shows up within 5 minutes.
