All runs of a test
The All runs page shows every run of one test, so you can decide in seconds whether it is stable, flaky, failing or broken by a build, on which browsers and devices, since when, and with which error. It replaces the scatter plot of the former Test Insights page.
A test is every run with exactly the same name. Name your tests with the name capability, or through the API, and use the same name every time the test runs.
Tests without a name (unnamed test…) have no history to show.
There are several ways to open it:
- On a test's detail page, the History strip in the header shows its last 20 runs as bars, oldest left. Click All runs next to it.
- On the Test Analytics dashboard, click a test in Needs attention, or Runs → under an error in Top errors.
- On a day page, click All runs next to a run or a fixed test.
- On a build page, click Runs → next to a test under Since <build>, or All runs → next to a session.
Range and filters
| Control | Options |
|---|---|
| Range |
24h, 7d, 30d (the default), 90d or Custom: a From and To date, up to 366 days. |
| Environment | Only the runs on one browser or device. The list holds the environments this test ran on in the range. |
| Build | Only the runs of one build. The list holds the builds this test ran in in the range. |
| Result | Passed or Failed runs only. |
A range holds up to the newest 1,000 runs of the test. When it has more, the page says so under the verdict: pick a shorter range to see all of them.
The verdict
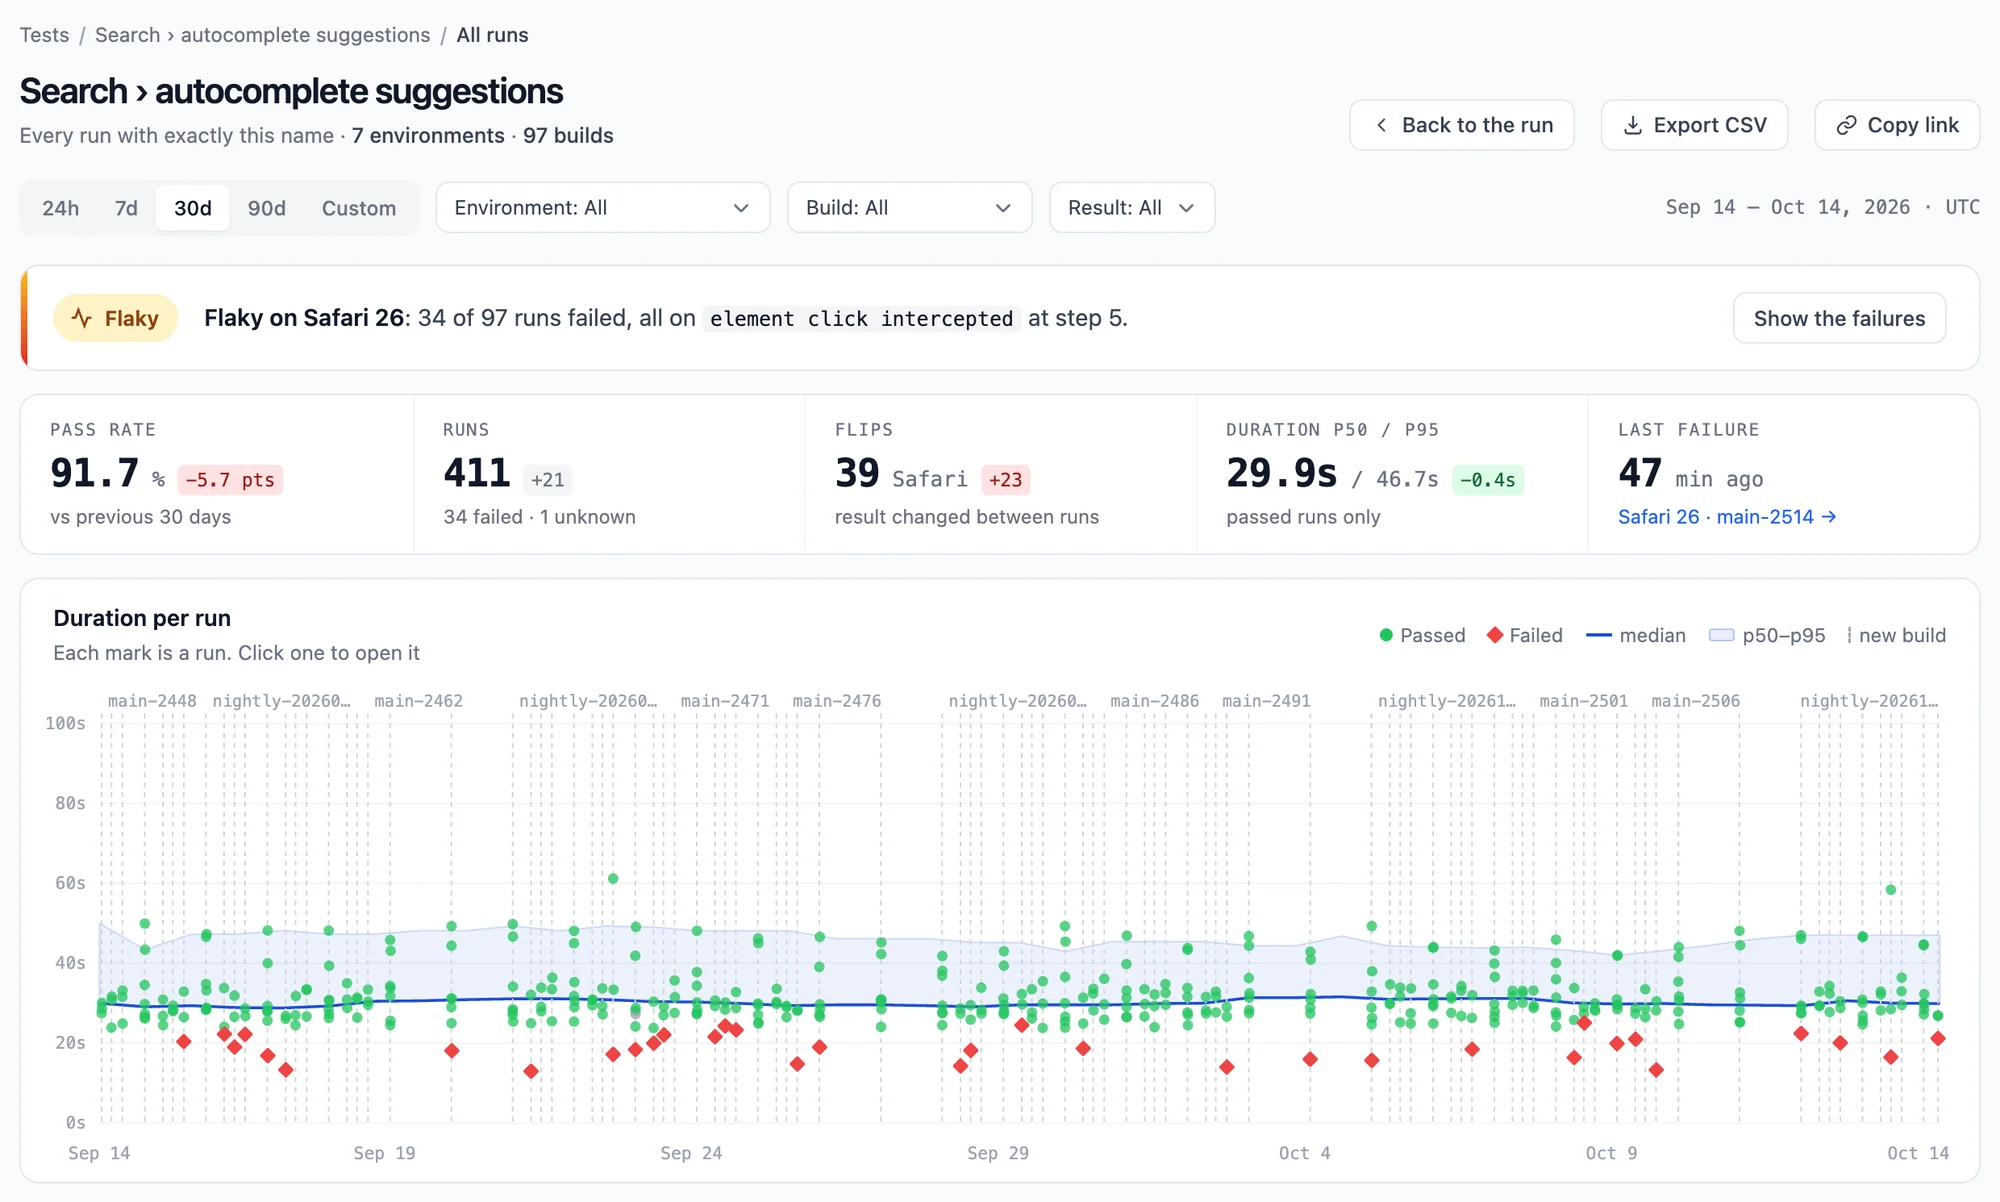
The card at the top reads the runs for you and sums them up in one sentence, with a label. You do not have to study the chart to triage a test.


| Label | When | Example |
|---|---|---|
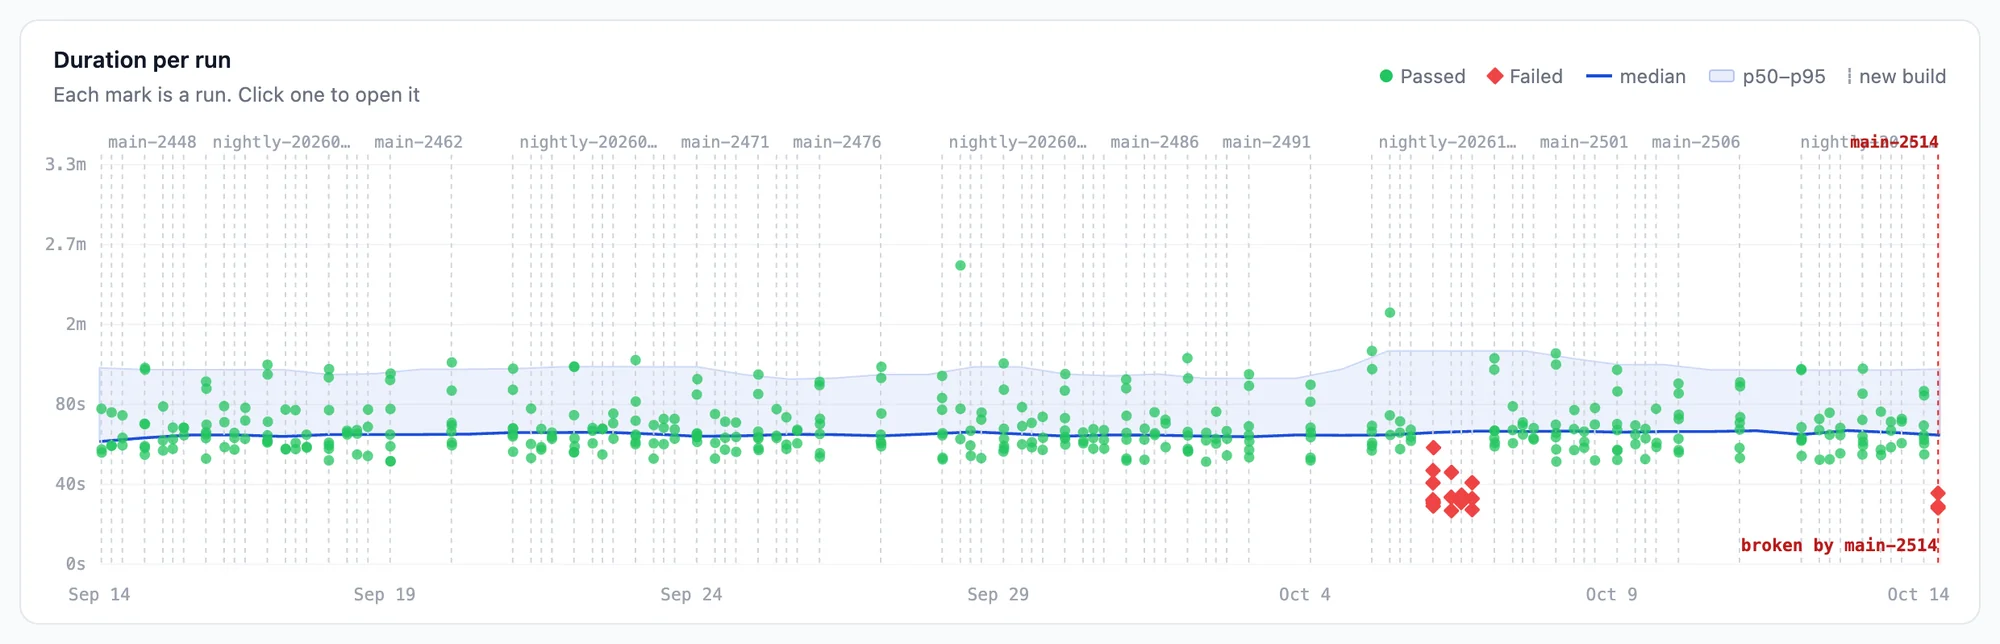
| Broken | The latest build failed every one of its runs (at least 2), and an earlier build passed. | Broken since build 1.42.0 on every browser: all 6 of its runs failed. |
| Failing | The last 5 runs or more all failed, or an environment failed every one of its runs (at least 3). | Failing on Safari 18: all 7 of its runs failed, since Oct 2. |
| Flaky | On an environment with 5 or more passed or failed runs, between 10% and 90% failed, and the result changed at least twice. | Flaky on Firefox 143: 4 of 19 runs failed. |
| Stable | None of the above. Occasional failures are called one-offs. | Stable: 58 of 59 runs passed; the failure was a one-off. |
| Unknown | Every run ended without a result. | No result: all 12 runs ended without passing or failing. |
| No runs | The test did not finish a run in this range. |
Once the errors are read (a moment after the page shows), the sentence also names the error when all failures share one, for example …, all on element not interactable at step 11.
When an earlier build broke the test and a later build fixed it, the verdict says that too: Separately, build 1.40.2 broke it on Chrome 141: all 3 of its runs failed, until 1.40.3 fixed it.
Show the failures opens the Failed tab of Runs. All rules and thresholds are on Metrics and definitions.
The numbers
Each number is compared with the range of the same length just before this one.
| Number | What it is |
|---|---|
| Pass rate | Passed out of passed and failed runs, with the change in points. |
| Runs | The test's runs in the range, and how many failed or have no result. |
| Flips | How often the result changed between consecutive runs on the same environment, for the environment where it changed the most (named next to the number). A stable or a constantly failing test has few flips; a flaky test has many. |
| Duration p50 / p95 | The median and 95th percentile duration of the passed runs, with the change of the median in seconds. |
| Last failure | How long ago the test last failed, and where (environment and build). Click it to open that run. |
Duration per run
A chart with a mark for every run, placed at the time it started (across) and its duration (up):
- Green dot: passed. Red diamond: failed. Grey dot: no result.
- Blue line: the median duration of the passed runs, moving along the range, so you see when the test got slower.
- Blue band: from p50 to p95 of the passed runs. A passed run above the band is slower than 95% of the others. With too few passed runs for a moving median, a dashed line shows the median of all passed runs instead.
- Dashed vertical lines: where each build first ran, labelled with the build name.
- Shaded area: a build that failed every run, up to the build that fixed it (or to the end of the range if it is still broken).
- A run far slower than all others, such as one that hung until a timeout, is drawn on the top edge so it does not flatten the rest of the chart.
The legend only lists what the chart draws. Hover over a mark to see its result and environment, when it ran, its build and duration, and for a failed run its error. Click a mark to open the run in the test panel next to the page.
By environment and per day
By environment has a row per browser or device the test ran on:
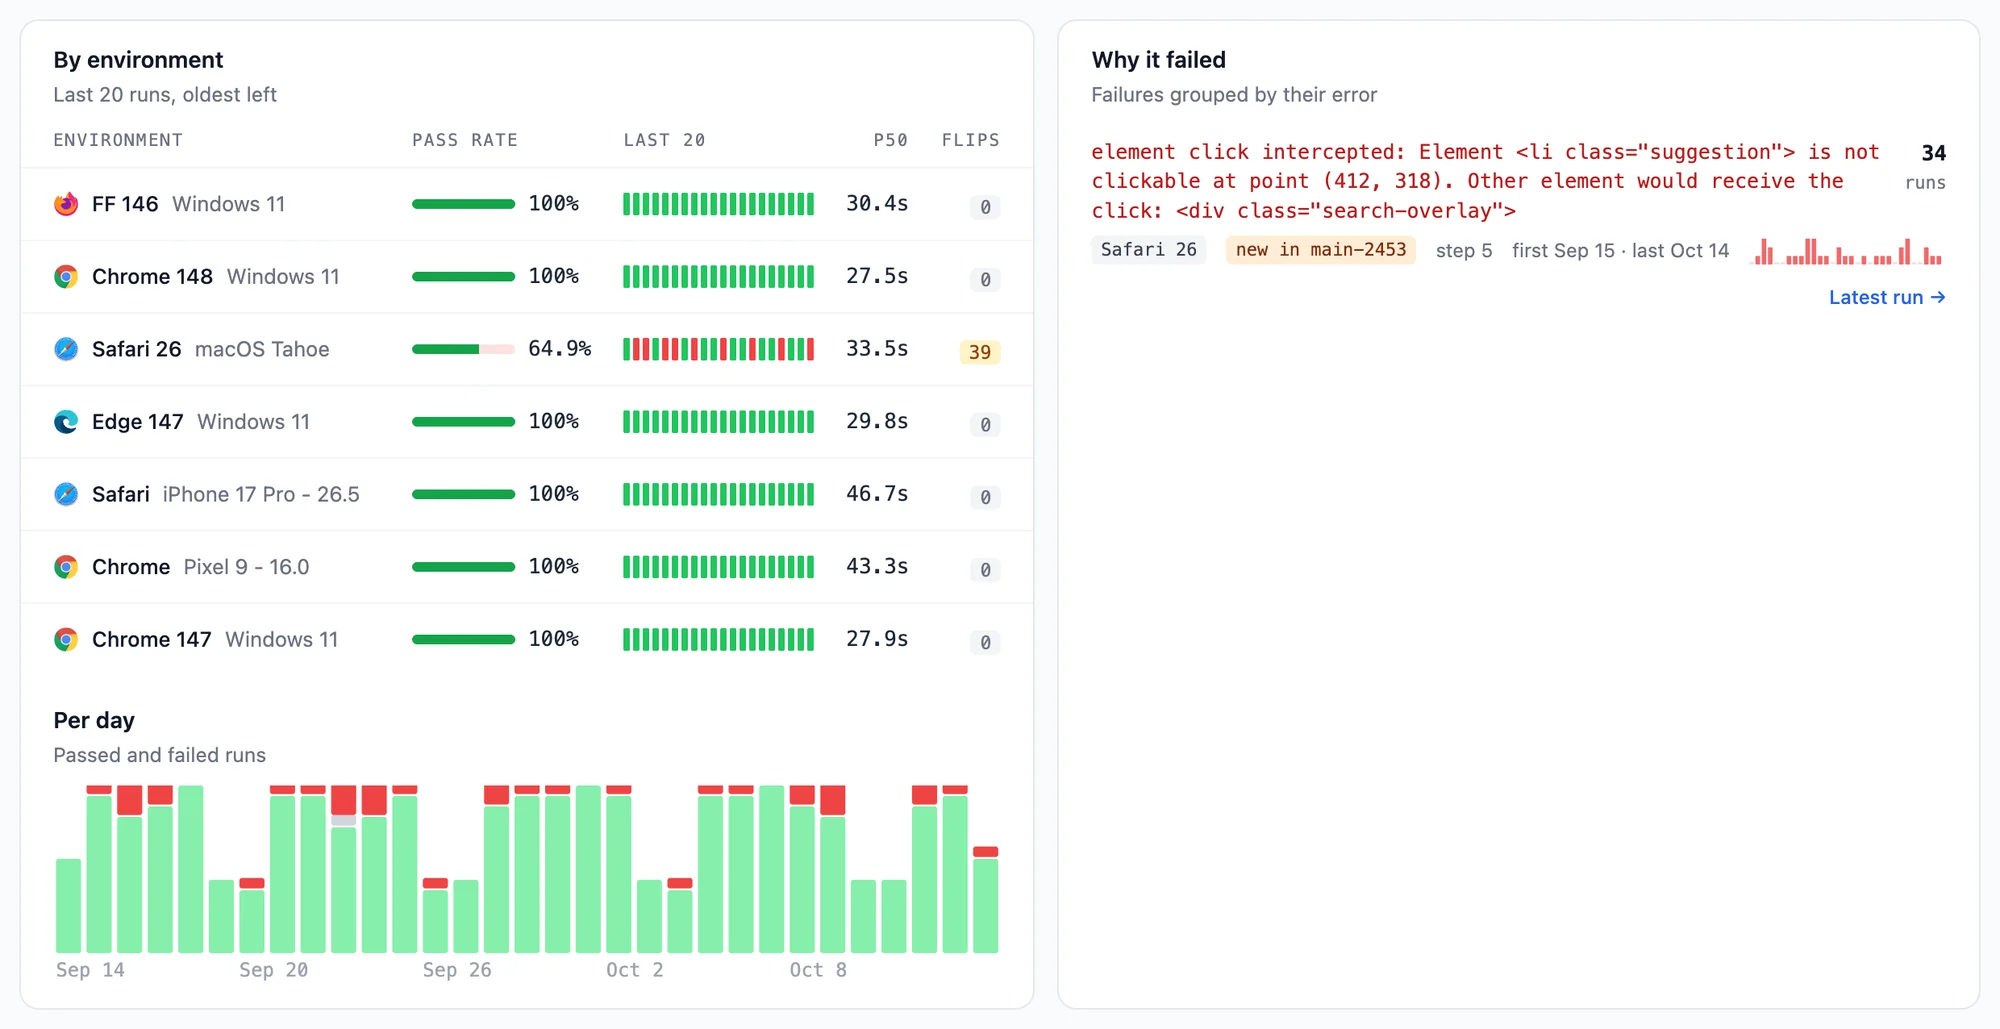
- Pass rate on that environment.
- Last 20: its last 20 runs there, oldest on the left: green passed, red failed, grey unknown. A flaky test shows red bars scattered between green ones; a failing one shows red at the end.
- p50: the median duration of its passed runs there.
- Flips: how often its result changed there. More than 6 is highlighted.
Per day shows the test's passed (green), failed (red) and unknown (grey) runs for each day of the range. Hover over a day for its numbers.
Why it failed
The test's failures, grouped by their error, most runs first. The error of a run is the one its detail page shows: the last step in error and its message. Parts of a message that change from run to run (the Chrome version Chrome adds, element and session ids, durations) are ignored, so the same failure is one group.
Each group shows:
- the error message and how many runs failed with it,
- the browsers or devices it happened on,
-
new in <build>when it first happened in a build after the start of the range: the build that introduced it, - the step it failed at, for example
step 11, - the first and last day it happened, and a bar per day with its failures,
- Latest run →, which opens its latest run in the test panel.
The errors are read from the steps of each run, so this card fills a moment after the page shows. It groups the newest 40 failures; the Failed tab of Runs lists all of them. A failure without a step in error (the test marked itself as failed, for example after a visual or accessibility check) is counted under the list, but not grouped.
Runs
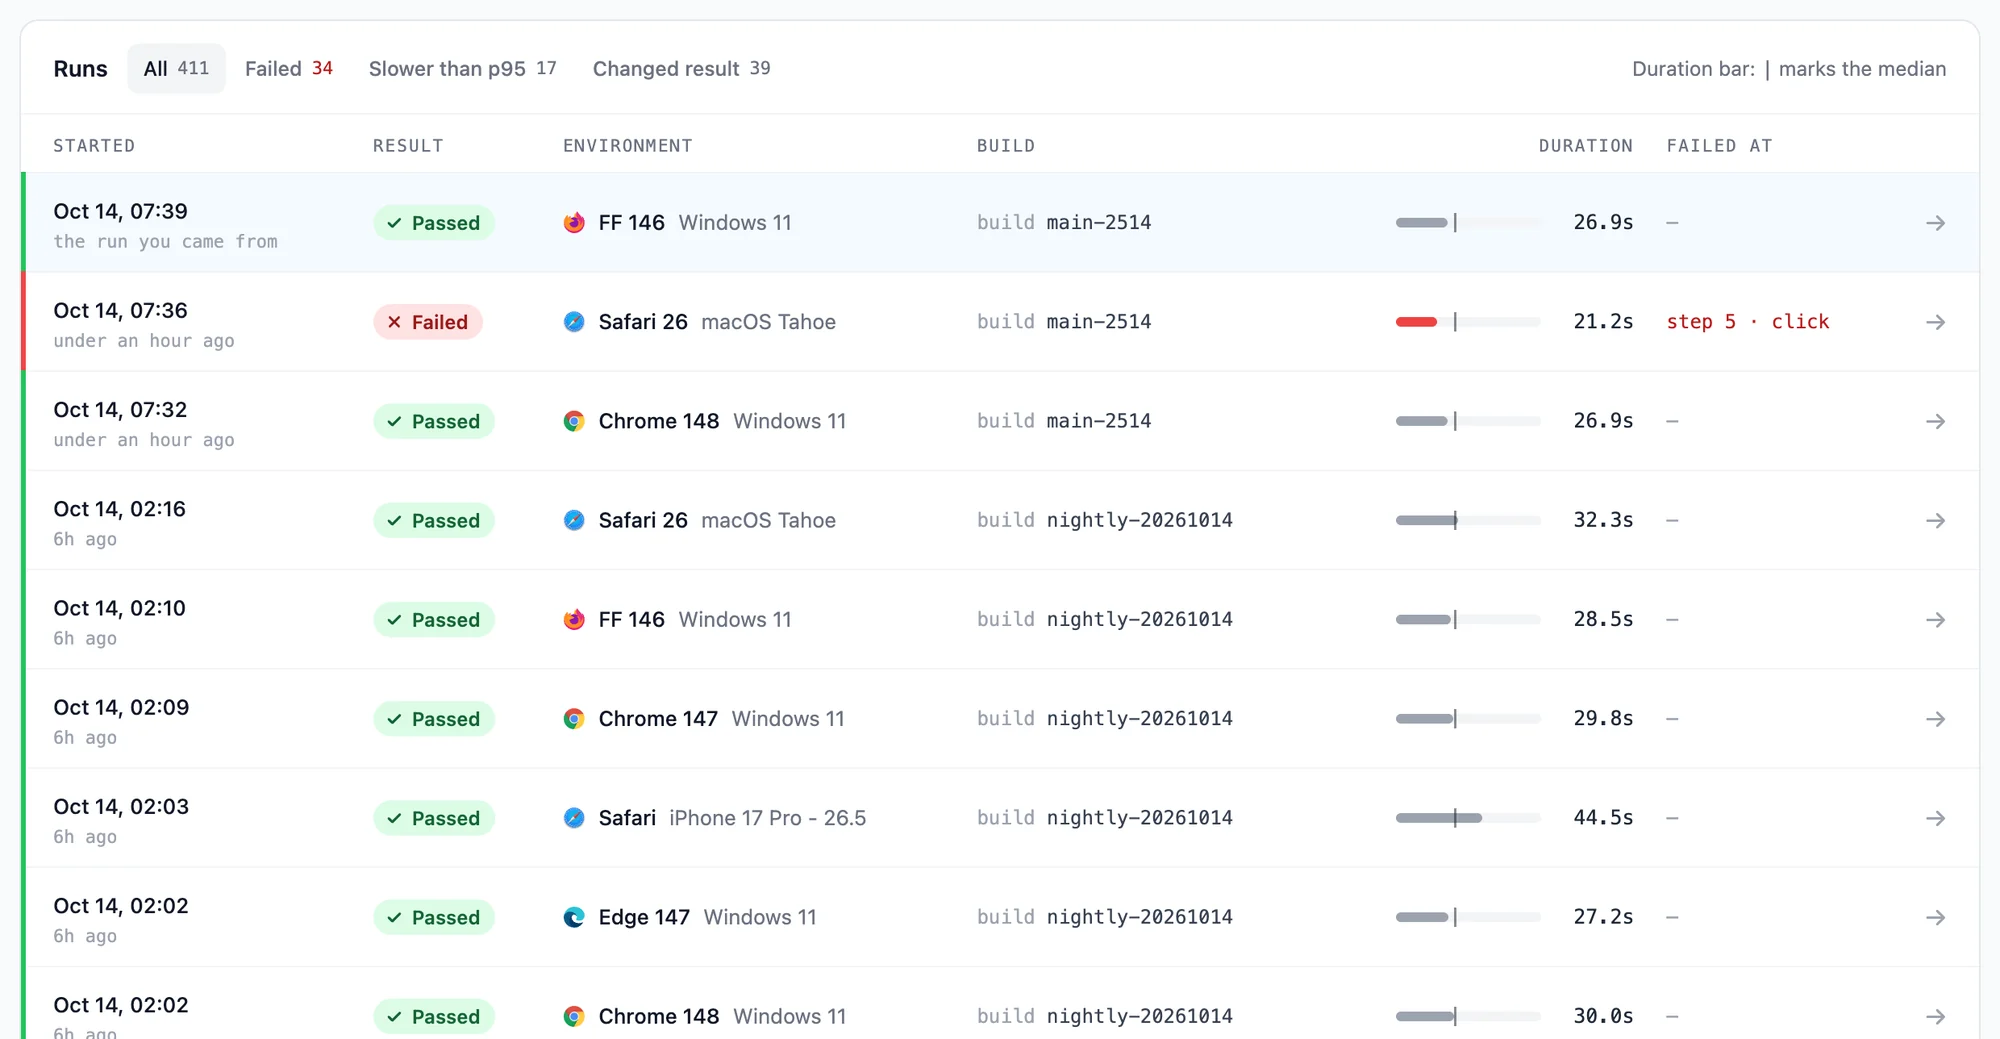
Every run of the test in the range, newest first:
| Column | Shows |
|---|---|
| Started | When the run started (UTC) and how long ago. The run you came from is highlighted and marked the run you came from. |
| Result | Passed, Failed or Unknown. |
| Environment | The browser or device, and its operating system. |
| Build | The build it ran in, if any. |
| Duration | The duration, with a bar: red for a failed run, amber for a passed run slower than p95, grey otherwise. The tick on the bar marks the median. |
| Failed at | For a failed run, the step and command it failed at, for example step 7 · click. |
The tabs narrow the list and show how many runs each has:
| Tab | Lists |
|---|---|
| All | Every run. |
| Failed | The failed runs. |
| Slower than p95 | Passed runs that took longer than the p95 duration. |
| Changed result | Runs whose result differs from the run before them on the same environment: the moments it started failing or passing again. |
The first 12 runs show; Load 25 more adds the next ones. Click a run to open it in the test panel next to the list, with its video, steps and logs. Back to the run at the top returns to the run you came from.
Copy link and CSV export
The range, filters and the open tab are part of the URL: Copy link copies it to share this exact view.
Export CSV downloads the runs in the current range, filters and tab, newest first, named after the test:
| Column | Contains |
|---|---|
started_at |
When the run started, in UTC (ISO 8601) |
result |
passed, failed or unknown
|
browser |
The browser name and version |
os |
The operating system or device |
build |
The build name, if any |
duration_seconds |
From start to finish, in seconds |
session_id |
The session id, as used by the REST API |
url |
The link to the run in the member dashboard |
