Build analytics
A build is a group of test runs, usually all the tests of one CI run.
Add a build capability to your tests and TestingBot groups every run with the same build name together.
The build page answers the question you have when CI goes red: can this build merge, and if not, what did it break? It compares the build with the build before it, test by test and browser by browser, so a test that was already flaky is not blamed on your change.
The builds list
Automated Builds in the member dashboard lists your builds, newest first, with their tests, status and start time. Filter the list by build name, status or start date, and click a build to open its page. The newest builds of a range are also on the Test Analytics dashboard, under Recent builds.
While a build is still running (a session is running, or one started or finished in the last 10 minutes), its page shows the live sessions table, which adds sessions as they start. Once the build is quiet, the page shows the full analysis described below.
The build before
Most of the page compares this build with an earlier one. TestingBot picks that build in this order:
- The build you choose in Compare with, in the top right.
- With a GitHub CI link (registered with
POST /v1/builds/{id}/ci): the newest earlier build on the same repository and branch. - Otherwise: the newest of the 20 earlier builds that ran at least half of this build's tests. A build with the same name pattern is preferred, so
1.42.0is compared with1.41.0andnightly 20261008.1withnightly 20261007.1, not with a run of another suite.
Runs are compared by test name and environment. When a suite puts the build name at the front of each test name, such as nightly 20261008.1-Login, that part is taken off so the same test matches across builds.
The head of the page also shows the build's result, its GitHub pull request, branch and commit when it has a CI link, when it ran, and buttons to the builds either side.
Status badge gives you a badge for the build's status, and the ⋯ menu edits or deletes the build.
The verdict
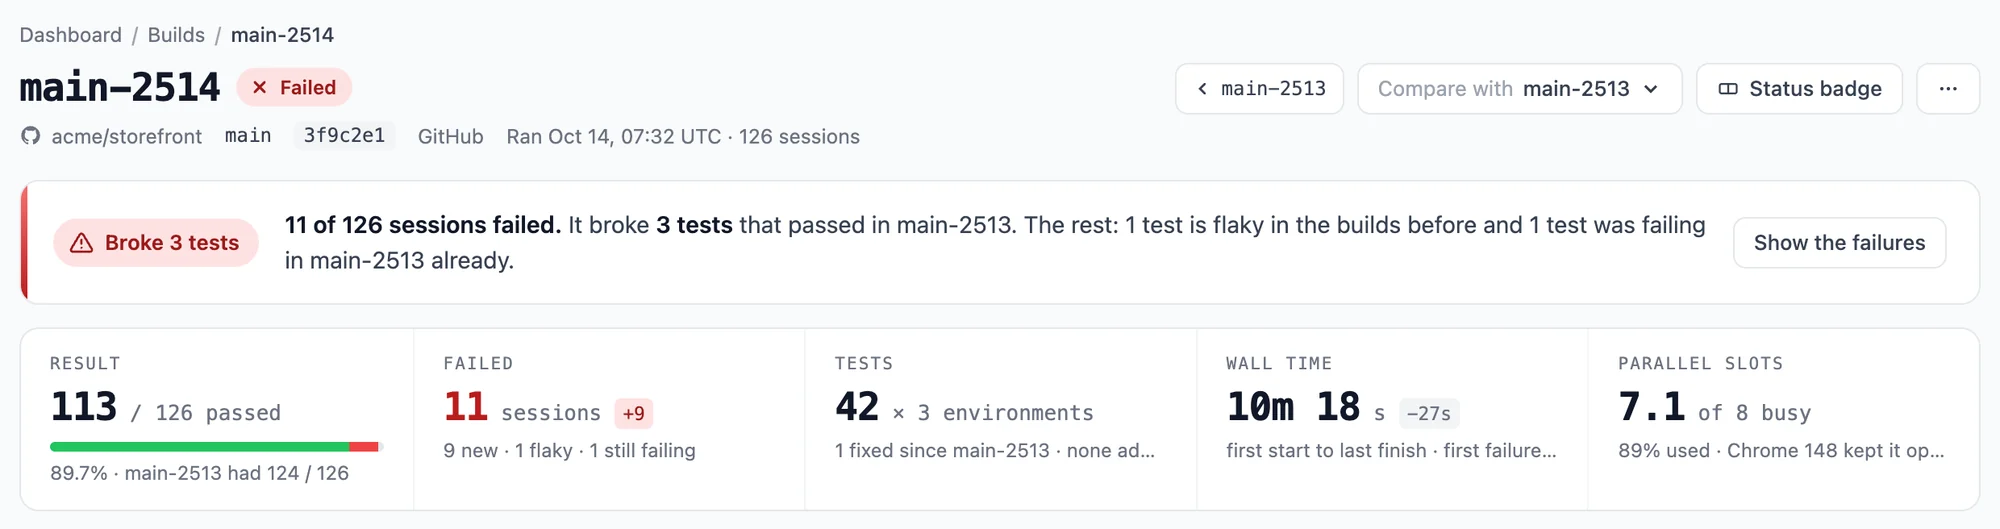
The first card says in one sentence what the build did against the build before:
| Label | When |
|---|---|
| Broke N tests | A test failed that passed in the build before. This is the one to look at before merging. |
| Flaky only | Every failure is a test that is flaky in the builds before too: not caused by this change. |
| Failed | Tests failed, but none that passed before: they were already failing, or the build before did not run them. |
| Passed | Nothing failed. |
| Running | Sessions have not reported back yet. |
| No result | No session passed or failed. |
| No sessions | The build has no sessions. |
Once the errors are read, the sentence names the error when the broken tests share one. Show the failures opens the failed sessions.
The numbers
| Number | What it is |
|---|---|
| Result | Passed sessions out of all sessions, with a bar, and what the build before had. |
| Failed | Failed sessions, with the change against the build before, split into new, flaky and still failing. |
| Tests | How many tests on how many environments, how many were fixed and how many were added since the build before. |
| Wall time | From the first session's start to the last session's finish, with the change against the build before (grey when it changed by less than 10%), and when the first failure happened. |
| Parallel slots | How much of the build's parallel slots it used: the sessions busy on average (all session time divided by the wall time) out of the most sessions that ran at once, for example Used 89% of 8 parallel slots, with the average under it. Its tooltip says what would make the build faster: more parallel slots when they were busy, more tests run in parallel when they sat idle. It also names the environment that kept the build open at the end, when one session ran alone. |
Tests × browsers
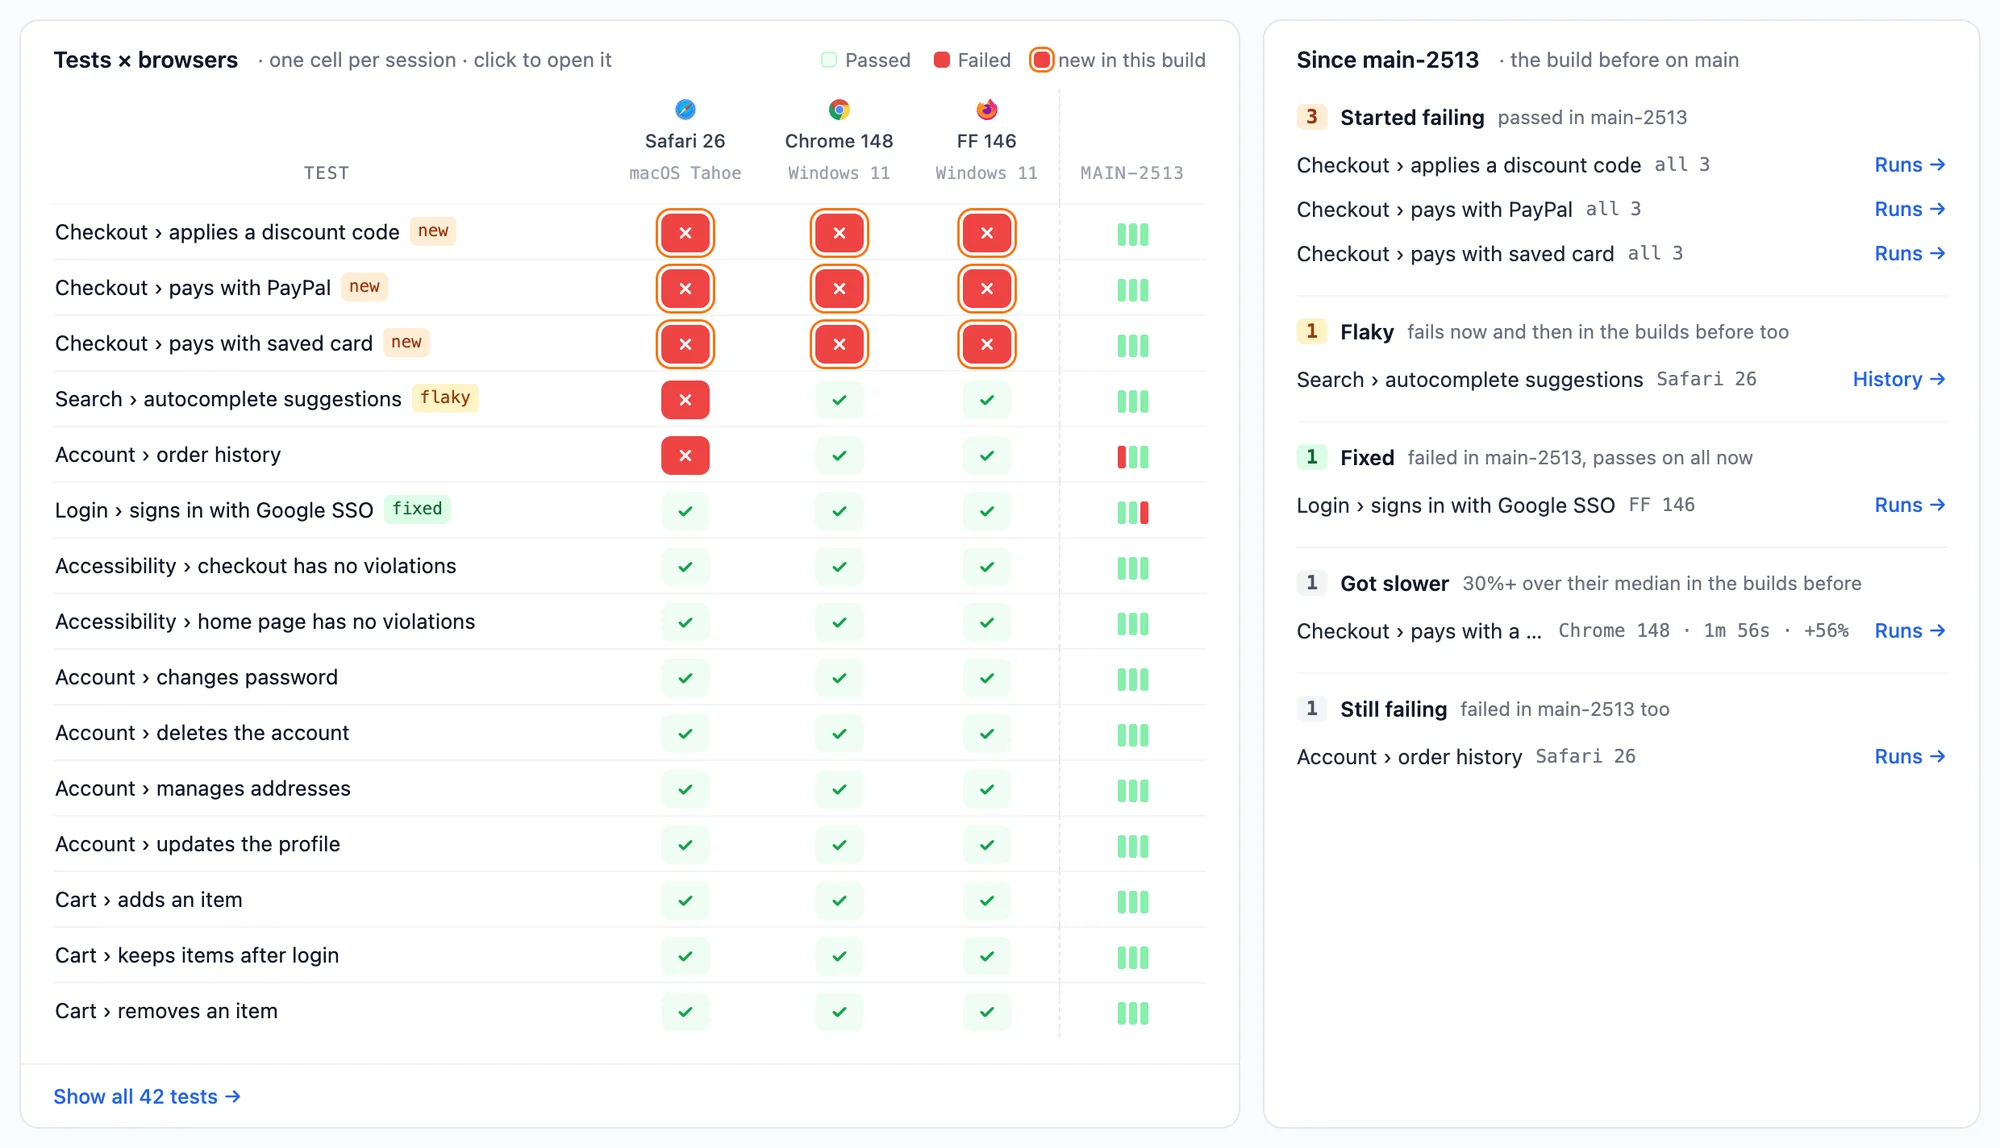
A grid with a row per test and a column per environment (the 10 with the most sessions). Each cell shows the sessions of that test on that environment: up to 3, so retries are visible. Next to each row, a strip shows the same test in the build before, one bar per column.
Failed tests come first. The first 15 rows show (or every failed test, if more failed); Show all lists the rest, up to 300 tests. Click a cell to open that session in the test panel.
Since the build before
The Since <build> card groups the tests by what changed. Next to the title it says how the build before was picked: the build before on the same branch, the build before with these tests, or the build you picked.
| Group | Tests that |
|---|---|
| Started failing | Failed here and passed in the build before. |
| Flaky | Failed here, but fail now and then in the builds before too: probably not this change. |
| Fixed | Failed in the build before and pass on every environment now. |
| Got slower | Took 30% or more over their median duration in the builds before, on the same environment. |
| Still failing | Failed here and in the build before. |
| No result in <build> | Failed here, and in the build before neither passed nor failed on that environment. |
Each test shows the environments it applies to, and links to its All runs page. Each group lists 5 tests; the Sessions table has all of them. Flaky and slower are read from the tests' runs in the 30 builds before this one, for the 40 tests with the most failures and the slowest.
When no earlier build ran at least half of these tests, the card says so; pick a build in Compare with to compare anyway.
How the build ran
A timeline of the build with a row per parallel slot and a bar per session, from its start to its end: light green passed, red failed, blue still running, grey no result. A session takes the first slot that is free when it starts.
- A dashed red line marks the first failure, with the time since the build started.
- The session that finished last is named at the top.
- Under the chart: the wall time, how much of the parallel slots the build used, and how long the last session ran alone, if it did.
A long tail where one session runs alone means the build waits for one slow test: split it, or start it first. Hover over a bar to see the session, its environment, duration and error. Click it to open the session. A build with more than 1,500 sessions draws the first 1,500 and says so.
Why it failed and slowest tests
Why it failed groups the build's failed sessions by their error, most sessions first, the same way as on a test's All runs page. It loads a moment after the page, because the errors are read from the sessions' steps.
An error that only this build has is tagged new in <build>; one that also failed in the build before is tagged failed before too. Open a session opens one of its sessions.
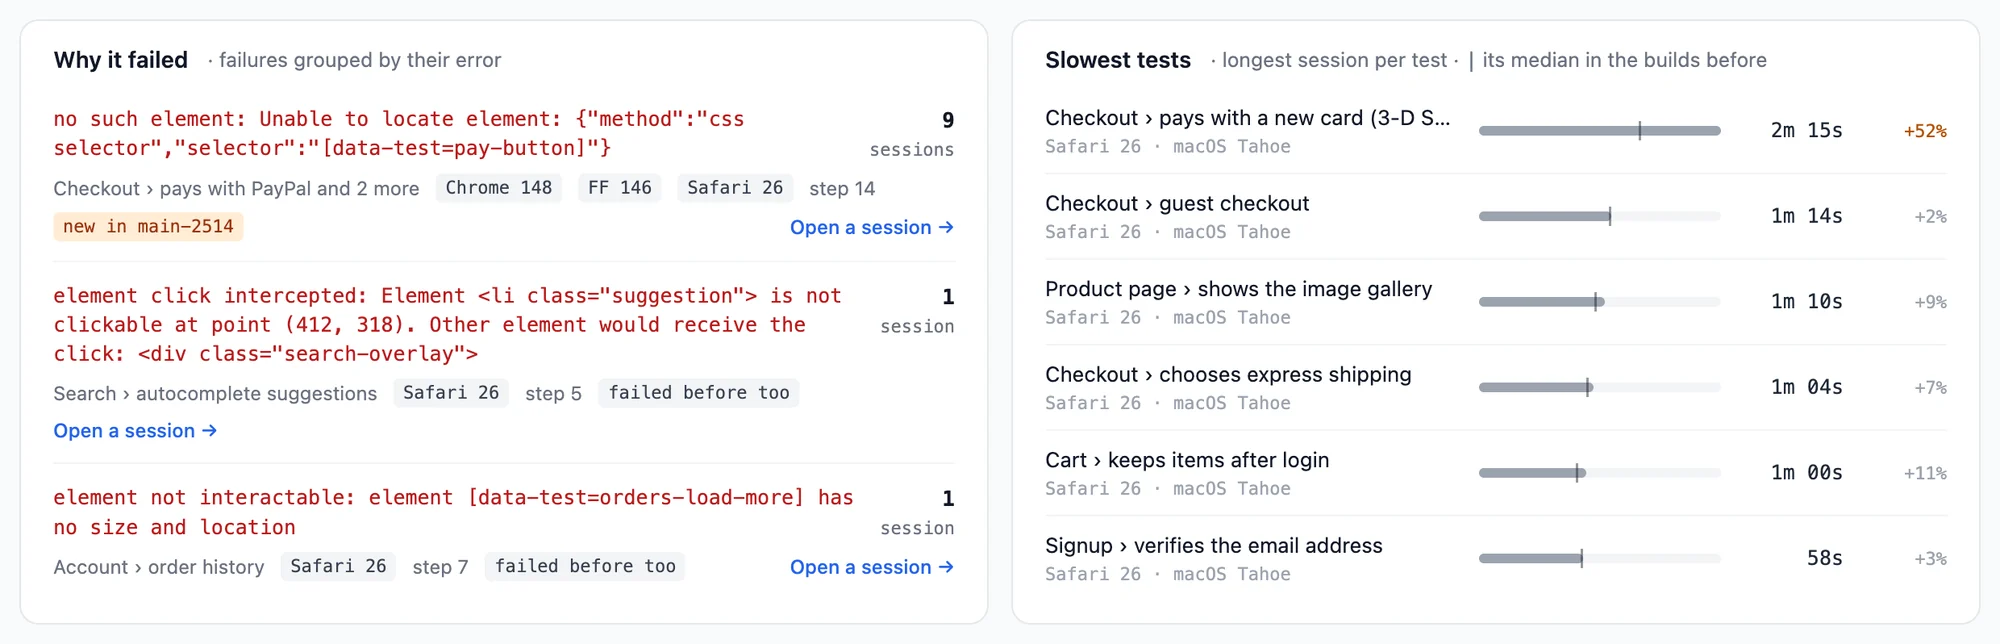
Slowest tests lists the 6 tests with the longest sessions in the build. Each shows its longest session with a bar, a tick at its median duration on the same environment in the builds before, and how much slower it was. 30% or more is highlighted.
A build with visual tests also shows a Visual comparisons summary of its screenshot comparisons. When a test is retried in the build, each snapshot it took counts once, with the result of its last attempt; the summary says how many earlier comparisons it left out.
Sessions
Every session of the build, failed first, with its test, result, environment, duration, the step it failed at, and what it did against the build before. Each row links to the test's All runs page.
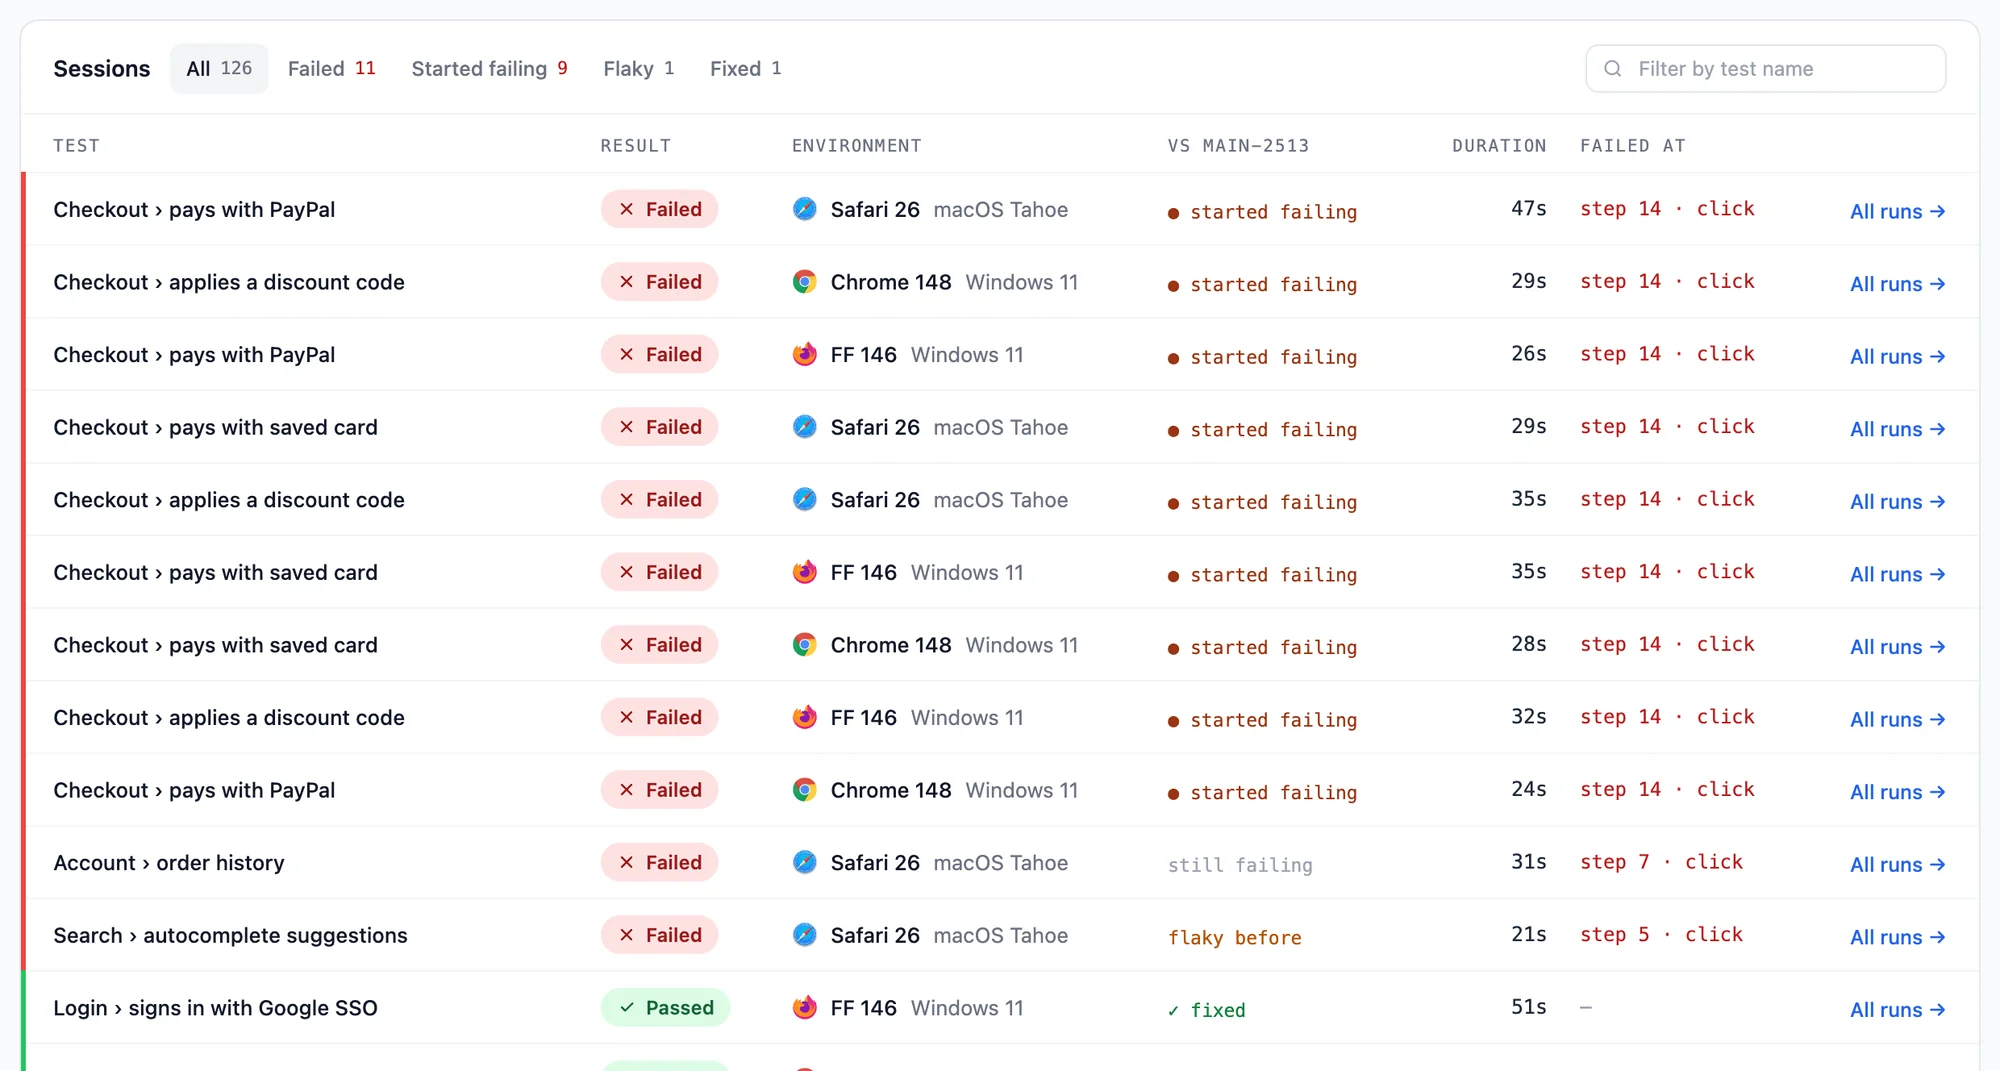
The tabs are All, Failed, Started failing, Flaky and Fixed; without a build before to compare with, only All and Failed. Filter by test name narrows the list. The first 25 sessions show; Load more adds the next 25.
Build efficiency
The shared build page (the page a status badge links to) shows a build efficiency percentage. It tells you how well your test runner used parallel sessions to shorten the build.
It is the duration of the longest test in the build, as a percentage of the build's wall time:
- 10 tests of 30 seconds each, run one after the other, take 300 seconds: an efficiency of 10%.
- The same 10 tests run in parallel take 30 seconds, as long as the longest test: an efficiency of 100%.
| Efficiency | Degree of parallelization | Description |
|---|---|---|
| 0%-20% | Sequential | Your tests ran one after the other. Consider running them in parallel to shorten your build. |
| 20%-90% | Semi-parallel | Some tests ran in parallel. Add more parallel sessions to run all tests of the build at the same time. |
| 90%-100% | Fully parallel | The build is as fast as its longest test. |
On the build page in the member dashboard, Parallel slots and How the build ran show the same thing in more detail.
